Maarten van der Veen
See profileDick den Hertog
See profilePartner impact story: Using digital and data before and after disasters
510 supports the Red Cross
Providing aid and relief after a humanitarian disaster is a well-established practice and the Red Cross is one of the biggest organizations of its kind. But what if you could provide aid before disaster strikes? You could prevent a lot of unnecessary suffering and save a significant sum of money in the process. That's what 510, founded by Maarten van der Veen and named after the 510 million square kilometers that make up the earth's surface, does for the Red Cross, by using data science to provide insight to victims, responders and governments. By doing so, 510 does not only contribute to preparing for emergencies, but also to better decisions. "We help the Red Cross with data," Van der Veen explains. “Their volunteers do the work."
510 helps the Red Cross provide aid just before a disaster with the money that would usually be used for aid after a disaster. “To do so, we rely on analytics”, 510 founder Maarten van der Veen explains. “We predict the impact of the disaster by examining its nature and scope, which lets us create trust and willingness to deploy financial resources before the disaster strikes.” On top of that, Van der Veen’s team also maps damage after disasters and works on rumor tracking.
Predicting disaster impact
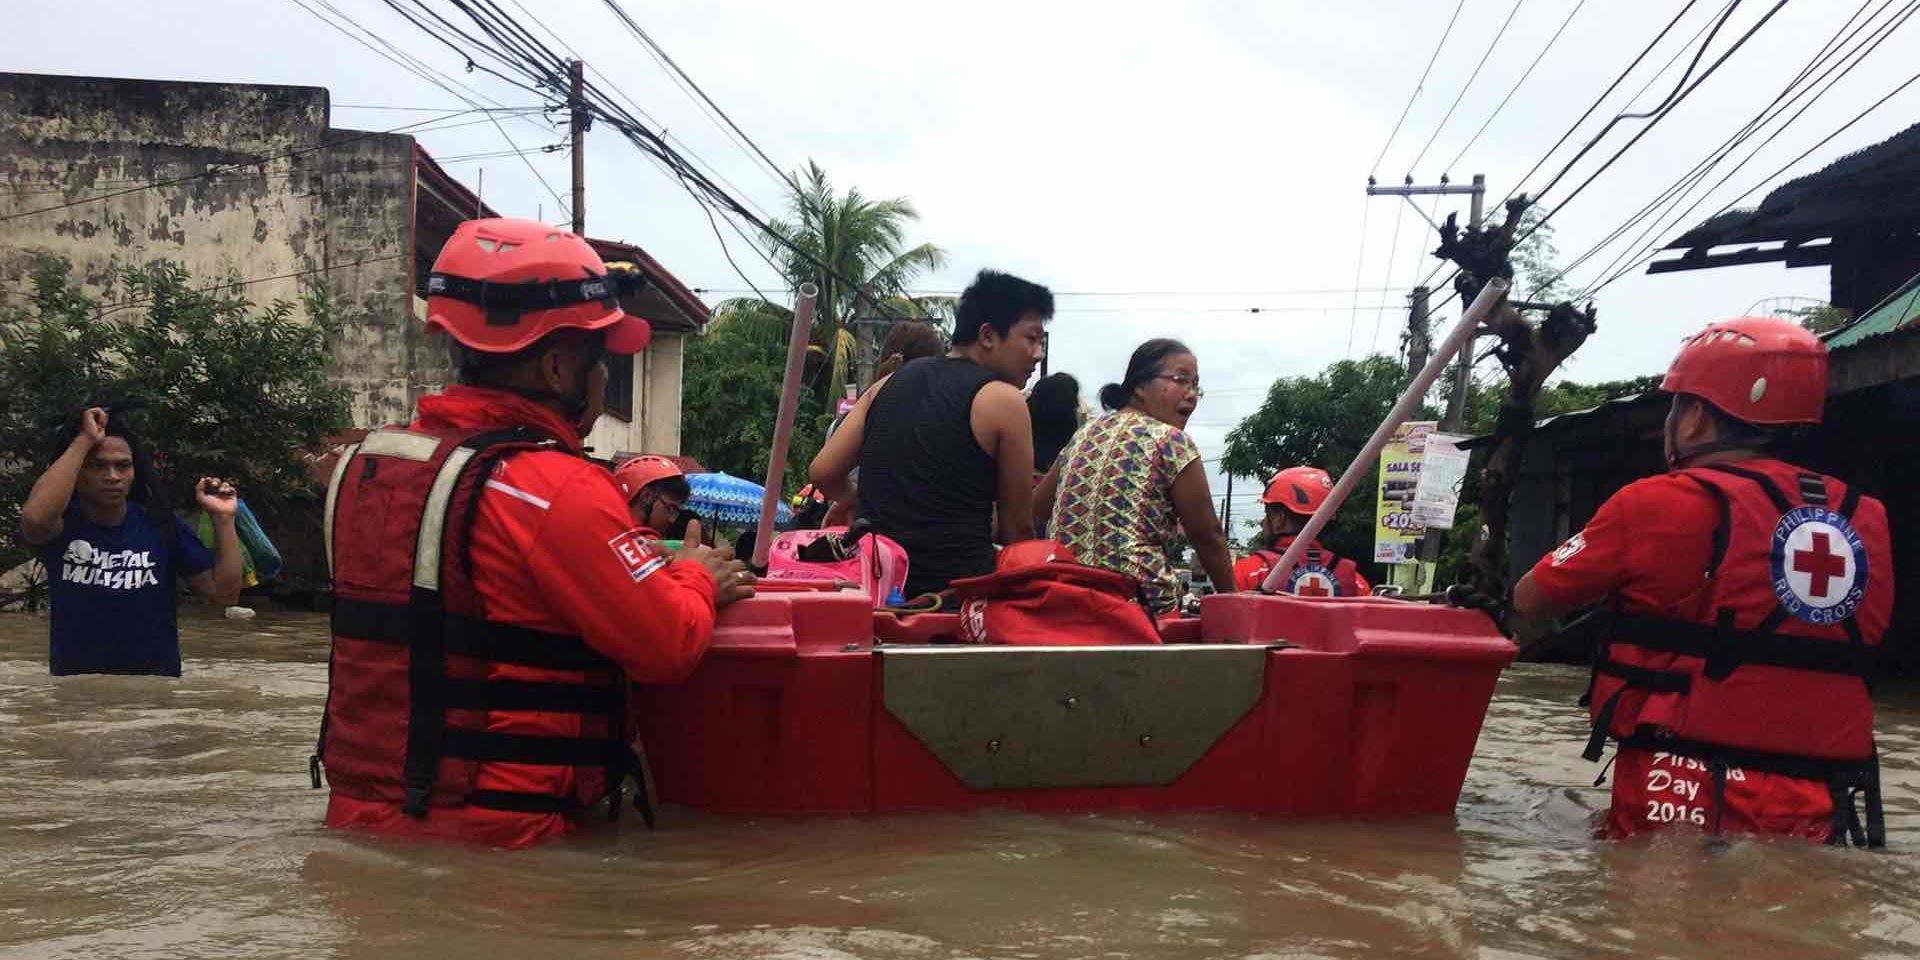
First off, an important question: how do you predict disasters, and can you always extract valuable information from data? “Some disasters, like earthquakes, are just unpredictable,” Van der Veen begins, “but weather-related disasters are actually quite easy to predict. Models for floods and droughts are based on hydroinformatic analyses, and the algorithms also incorporate information from regularly updated datasets, for example building information. Text mining allows us to find impact data, such as the number of damaged houses or the expected number of displaced people.” The Red Cross has already implemented a model developed to predict the damage caused by hurricanes in the Philippines, and the UN will follow shortly. “The model effectively gives organizations and emergency relief providers two days notice to help them get their relief efforts started on time. They do so in various ways: the Philippine Red Cross, for instance, heads to the area in question with miles of rope and quickly teaches people how to fix corrugated metal sheets to the foundation. After all, a house with a roof is less likely to be blown over, so reinforcing the roof helps you prevent a lot of damage to buildings.” It’s very difficult to quantify prevented damage, Van der Veen admits, “but we do know that money spent up front yields substantial savings later. Recent studies show that 1 euro spent on disaster preparation saves 3 euros in emergency aid, but if you can avoid building an entirely new house for the price of a length of rope, your savings will end up a lot higher.”
Money spent up front yields substantial savings afterwards. Recent studies show that 1 euro spent on disaster preparation saves 3 euros in emergency aid.
No regrets
It may sound like a no-brainer, but it is important to remember that models can be wrong. For example, a hurricane may veer slightly to the right or left at the last minute. Van der Veen: “That’s why the Red Cross always pursues a ‘no regrets’ strategy in planning its aid, opting for a method that will always have a positive outcome and will never lead to damage or waste money, such as helping people bring in the harvest earlier. That way, you prevent loss of income, so that the disaster doesn’t also lead to a shortage of money, leaving people without means to repair their homes or possessions.” The Red Cross relies on local meteorological data, enriching it with historical impact data. “This method has been in place for a decade or so, but we only started using data-driven models and the occasional machine learning four years ago. One of these models has helped us fight COVID-19. In the Netherlands, there is a limited group of people who refuse to be vaccinated, but vaccination readiness is low in the international community, partly because of a particularly tenacious rumor mill. That’s why the Red Cross uses rumor tracking: we built a kind of search classification and emotion-tagging algorithm that scans social media, which uses natural language processing to incorporate posts in different languages. The algorithm helps outline user groups involved in spreading rumors and provides a greater degree of insight into what kind of rumors are circulating. You can also intervene by engaging in risk communication and see if that helps. We’ve now rolled out this algorithm in several countries.”
This method has been in place for a decade or so, but we only started using data-driven models and the occasional machine learning four years ago.
Mapping damage
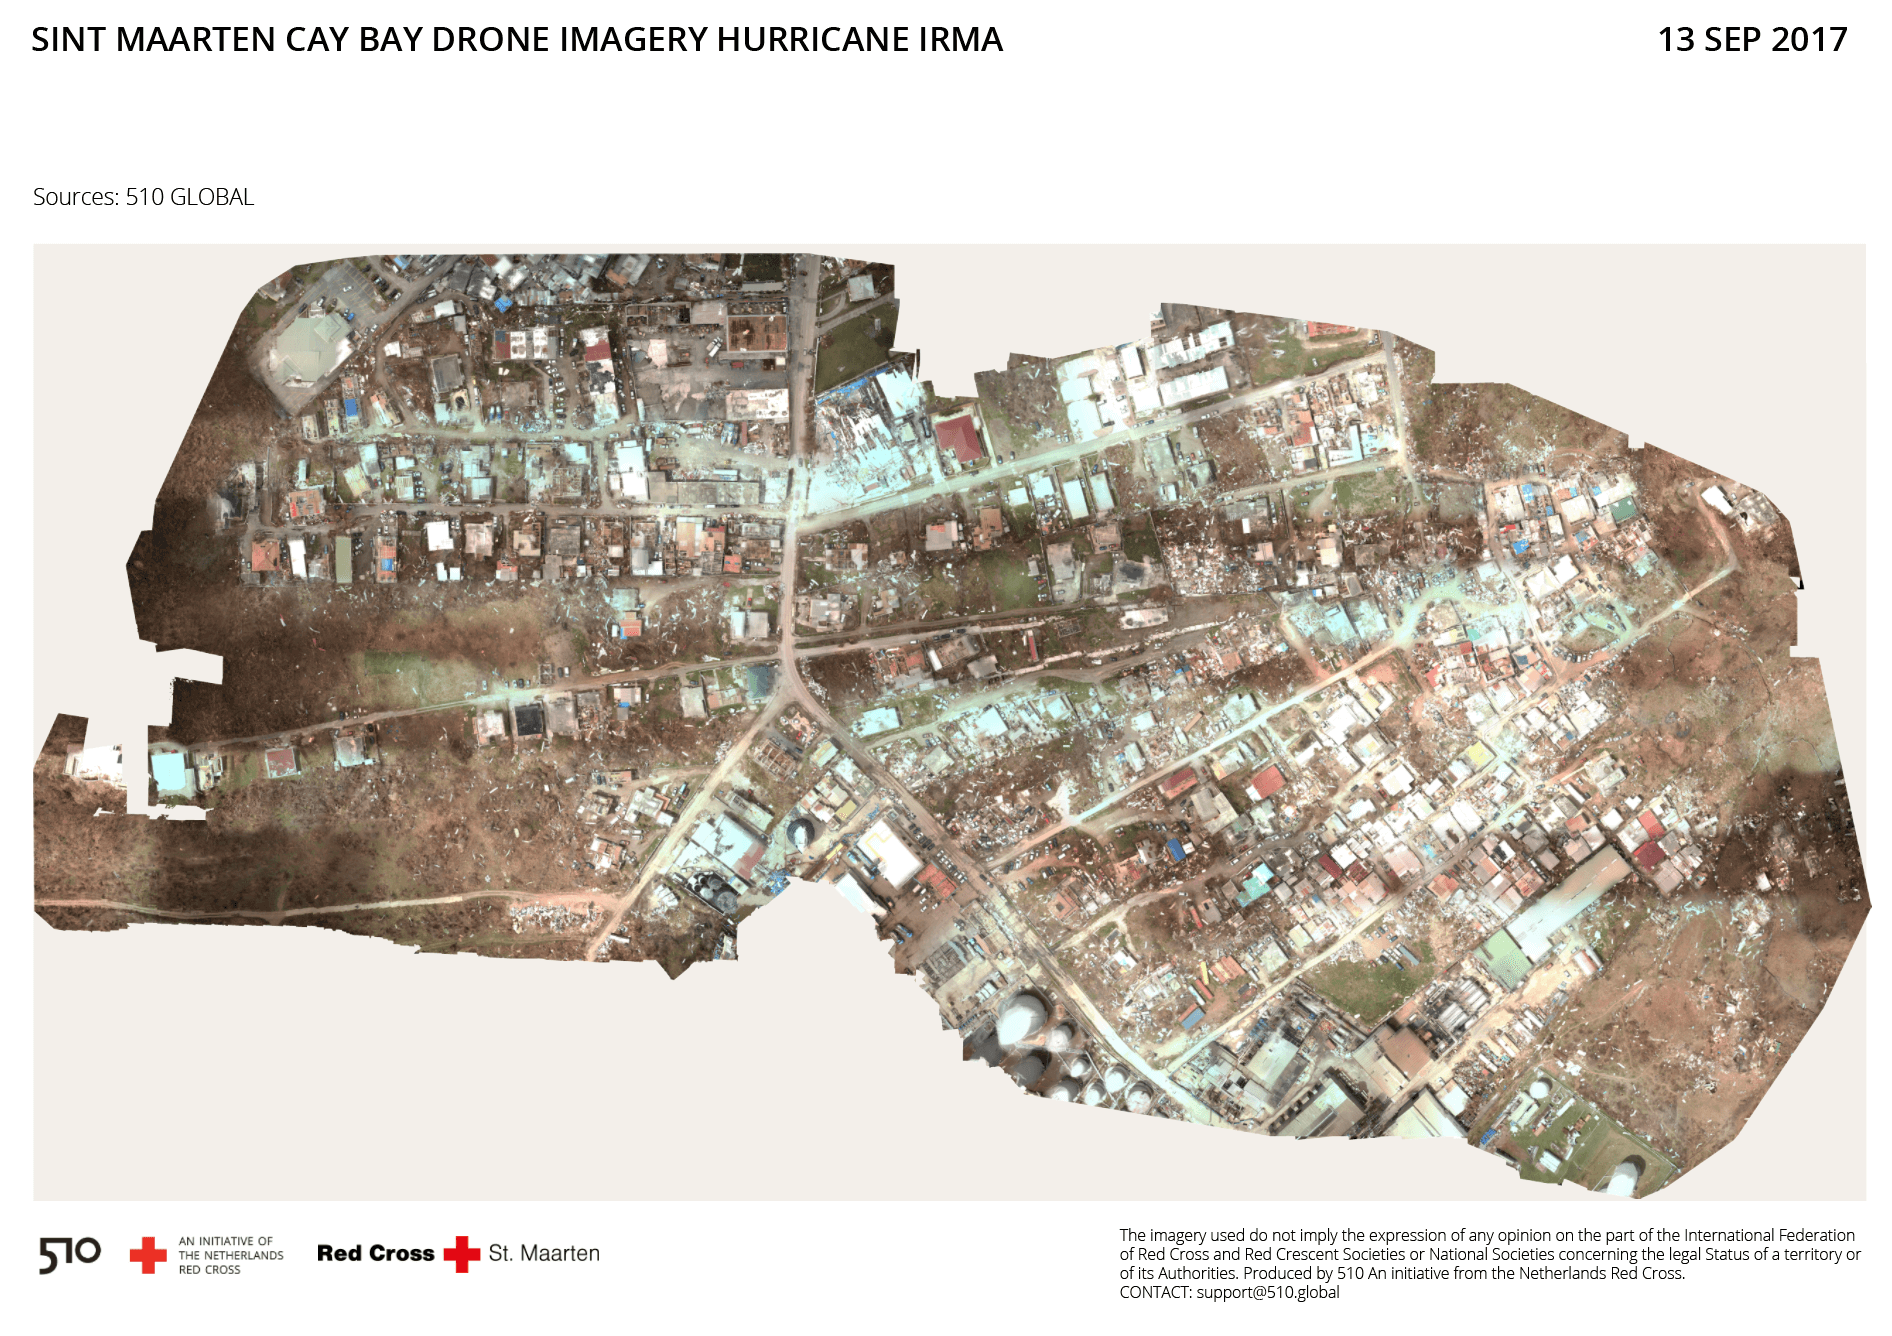
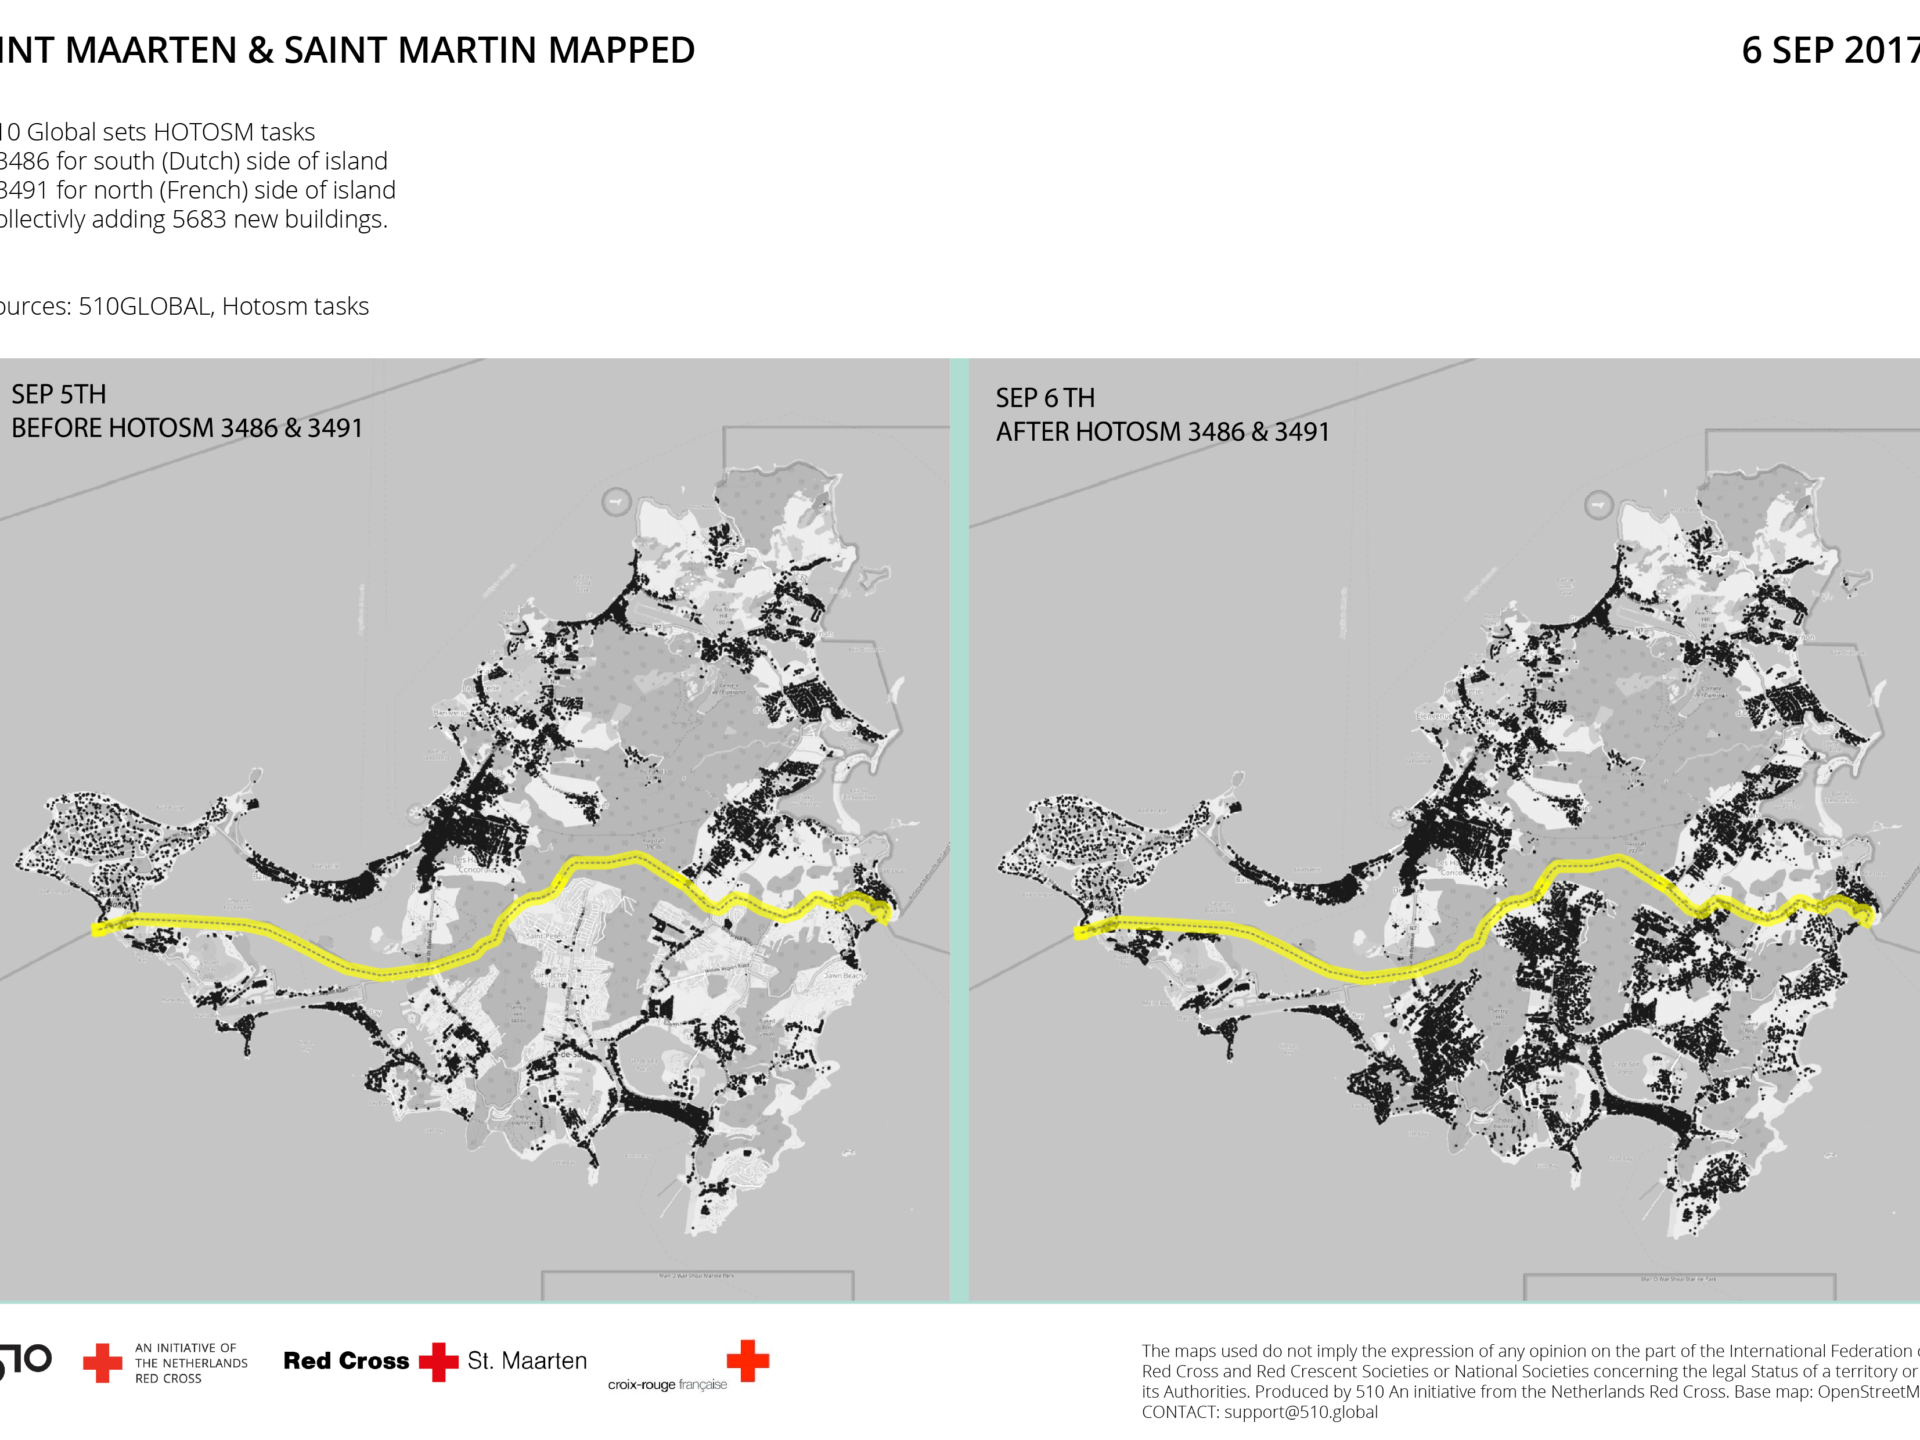
Even after a disaster, data analytics can still play a role. “Humanitarian aid organizations often did not have access to maps after a disaster”, Van der Veen explains, “as some countries don’t have a sound land registry, or don’t make their cadastral data public. Eight years ago we started a mapping community. In Open Street Map, you can team up with a large group of people to map an area to allow for an improved emergency response just before or after a disaster. We included damage analysis at a later stage, which first consisted of sending assessment teams into the area equipped with a phone to scout which home needed what kind of aid. It was an effective method in Sint-Maarten in 2017, as I witnessed with my own eyes, but there are only 20,000 homes on the island, and the challenge gets substantially harder with larger numbers. In response, we tried to build a model that uses aerial photos predating the disaster to automatically recognize buildings and classify damage after the disaster, which yielded a set of statistics for the entire area. We deployed this model after last year’s explosion in the port of Beirut.”
Dispelling skepticism
Van der Veen proudly tells us how the Red Cross was voted the second most inspiring brand in the Netherlands in 2020, after Too Good to Go. “Other NGOs also see us as a particularly innovative organization, so there are ways to convince non-profits that data can be valuable. We have shared all our results with various NGOs, letting them in on what we did, how we did it and what value it had. Many of them saw the light, as it were, and a fairly large number of NGOs have tried to build up data capacity themselves; an attempt that failed regularly. It’s proving difficult to build a system that lasts. The Red Cross consists of 193 societies and we work with 45, so we’ll hopefully inspire other NGOs as well. The Dutch Red Cross is doing well in terms of data, but they are not yet halfway to where they could be. There is still a lot of untapped potential, at the Red Cross and across the humanitarian sector. In fact, many of the organizations who need this support the most need to get a grip on their data. A major advantage of AWB is that it could enable NGOs to bring in capacity that they would otherwise not have the funds for. I feel for NGOs, to be honest, because they do not turn a profit and can spend every penny they don’t spend on data on humanitarian aid. Still, I would say that investing in analytics really pays off, especially if it also helps to dispel skepticism about the efficiency of emergency aid.”